

Home
Publications
SNID
[Graphics]
Contact
Below are a few animations and figures I have made. Feel free to use them for your own scientific presentations, with an appropriate credit. The gif animations were made using gifsicle.
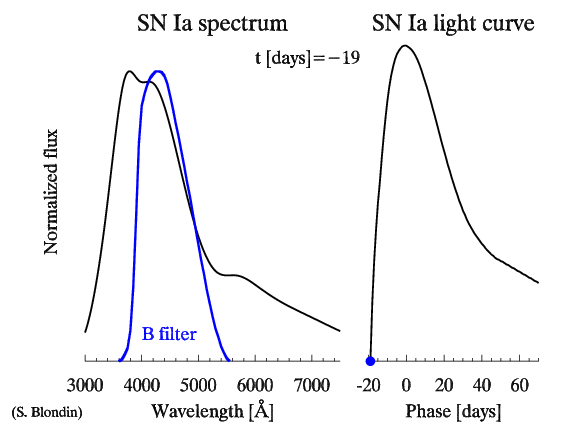
| Animation showing the evolution of a SN Ia spectrum with age (in days from maximum light). The right panel shows the corresponding B-band light curve. The spectra have been normalized to the maximum flux value. Based on the corresponding Nugent templates. |
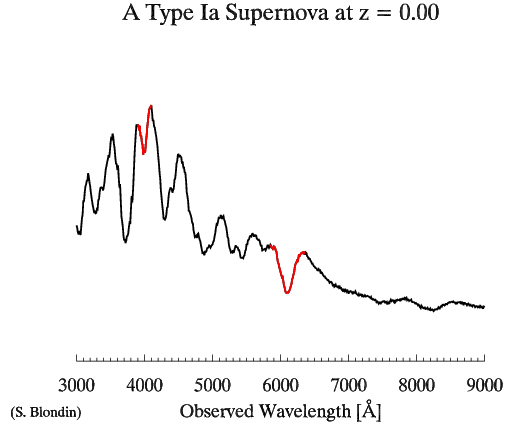
| Animation illustrating the difficulty of observing SN Ia at high redshifts. The red portions highlight the two characteristic Si II features at ~4000 and ~6150 Angstroms. |
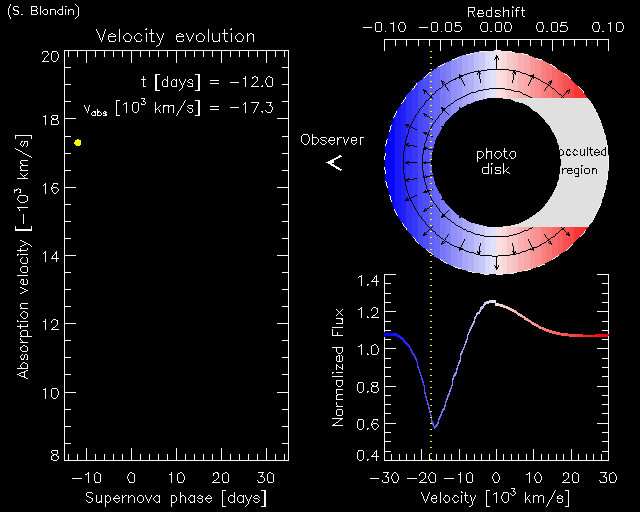
| Animation showing the evolution of a supernova line profile with age. The left panel shows measured blueshifts of the Si II line at ~6150 Angstroms in SN Ia spectra as a function of age (in days from maximum light), in units of -1000 km/s. The upper-right panel shows a schematic of a supernova atmosphere, with color contours of constant line-of-sight velocity, circular iso-density contours (in steps of log base 5), and expansion velocity vectors. The lower-right panel shows the corresponding P-Cygni profile. The vertical dotted line shows the locus of maximum absorption. |
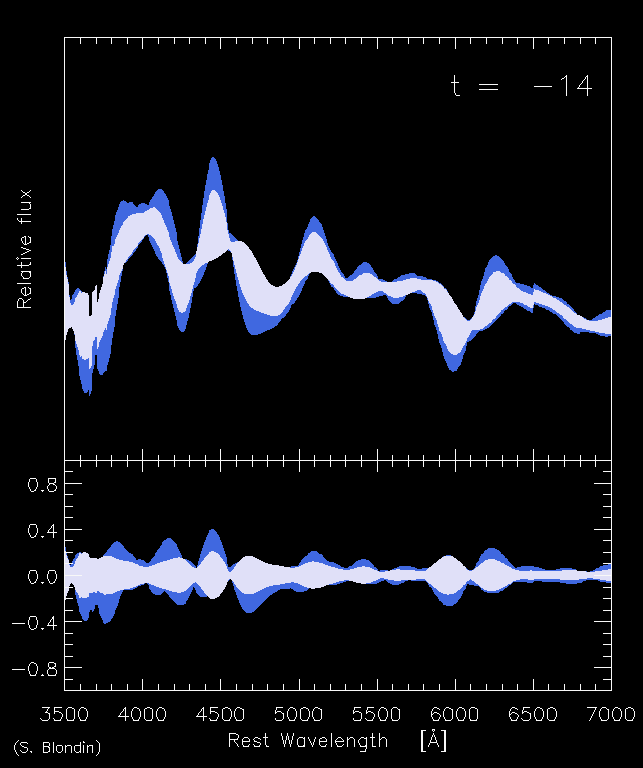
| Animation showing the mean evolution of SN Ia spectra between -14 and +25 days from maximum light. Upper panel: Standard (grey) and maximum (blue) deviation from the mean SN Ia spectrum. Lower panel: Standard (grey) and maximum (blue) fractional residuals from the mean SN Ia spectrum. The time and wavelength variations are real! |
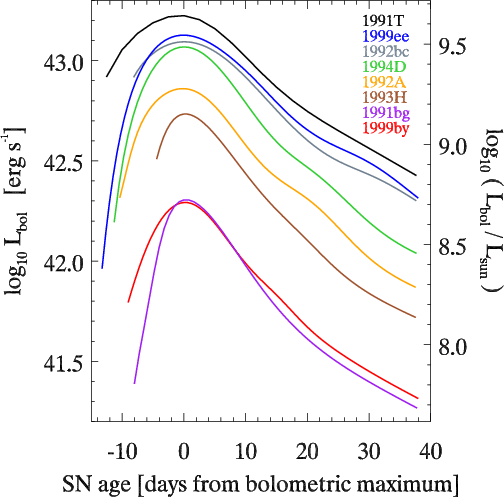
| Bolometric light curves of Type Ia supernovae, illustrating the range in peak luminosity and light-curve morphology. Data courtesy of Max Stritzinger. [Also in postscript] |
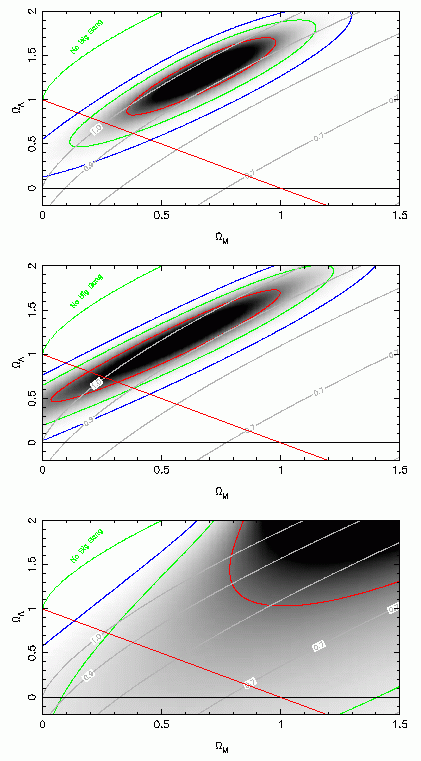
| Upper panel: SN Ia likelihood distribution for Omega_Lambda vs. Omega_Matter. The red (green,blue) ellipses correspond to the 1 sigma (2 sigma,3 sigma) contours. The input data are from Tonry et al (2003) and include only SN Ia within the Hubble flow ( z < 0.01) that are not highly extinguished (A_V < 0.5 mag). There is a clear degeneracy along 0.8 Omega_Lambda - 0.6 Omega_Matter, and the flat universe model (Omega_Lambda + Omega_Matter = 1, red line) does not lie within the 1 sigma (68% probability) contour. The grey contours correspond to the dynamical age of the universe, H_0 t_0. The SN Ia data favour H_0 t_0 = [0.9,1.0]. Middle panel: The three most distant SN Ia (z > 1) have been removed. Lower panel: Only SN Ia in the range 0.2 ≤ z ≤ 0.8 have been included, illustrating the vital importance of the nearby sample. |
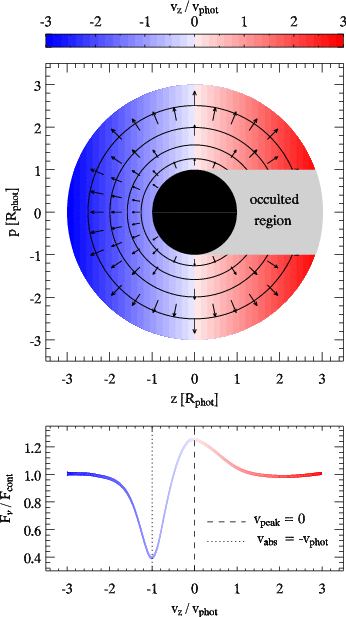
| Cartoon illustrating the density/velocity structure in SN Ia envelopes and subsequent line-profile morphology. Upper panel: Velocity contours (color coded) in units of the photospheric velocity, vphot, in the (z,p) plane. Overplotted (black circles) are logarithmic (base 5) density contours corresponding to a density exponent n = 7. Also shown are velocity vectors corresponding to a homologous velocity field (v(r) propto r). The black disk is the photo-disk of the supernova. The observer is located at (z,p) = (-infty,0), and hence the ``occulted region'' corresponds to -1 ≤ p ≤ 1 and z > 0. Lower panel: Synthetic line profile flux (per unit frequency, F_nu), normalized to the continuum flux F_cont, corresponding to the configuration above and computed using the parametrized code SYNOW (Fisher et al 1999). The abscissa is now the projected velocity, along (p = 0), v_p. In this model, the peak of emission is not shifted with respect to the rest wavelength (vpeak = 0), and the location of maximum absorption is blueshifted by an amount corresponding to the photospheric velocity (vabs = -vphot). [Also in postscript] |
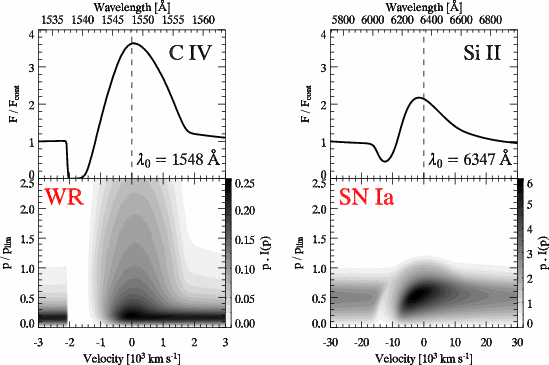
| Comparison of P-Cygni profiles of the resonance lines C IV λ1548 and Si II λ6347 in CMFGEN models of a nitrogen-rich Wolf-Rayet (WR) star and a Type Ia supernova, respectively. Lower panels: Gray-scale image of the quantity p I(p) as a function of p / p_lim and classical Doppler velocity v = [(λ/λ_0) - 1]c, where p is the impact parameter and I(p) the specific intensity along p (at v). λ_0 is the rest wavelength of the transition and c is the speed of light in vacuum. p_lim corresponds to the impact parameter where p I(p) = 0 for p > p_lim. For the SN Ia model, p_lim = 2.85 R_0, where R_0 is the base radius of the CMFGEN radial grid where the continuum optical depth tau_cont ~ 50 - a photosphere thus exists in this model configuration, corresponding here to a velocity of 9550 km/s. For the WR model, p_lim = 6.8 R_0, where R_0 is the hydrostatic radius of the WR star. The terminal velocity of this model is v_infty = 2000 km/s. Upper panels: Line-profile flux obtained by summing p I(p) over the range of p. The profiles have been normalized to the continuum flux, F_cont. [Also in postscript] |
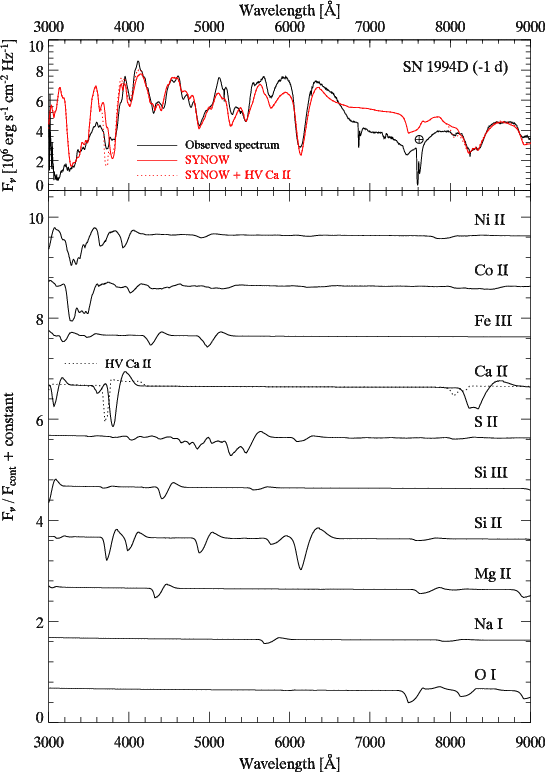
| Observed and synthetic spectra of SN 1994D at -1 d from B-band maximum. Upper panel: Comparison between the observed (black line) and synthetic (solid red line) spectra of SN 1994D, computed using the parametrized SYNOW code (Fisher et al 1999) using the same input parameters as Branch et al (2005). The red dotted line shows the effect of adding a high-velocity shell of Ca II in the SYNOW model. The location of the A-band atmospheric absorption feature is indicated with a telluric symbol. Lower panel: Synthetic line spectra for the individual ions used in the SYNOW model, normalized to the continuum synthetic flux (assumed to be a blackbody in SYNOW), in decreasing order of atomic weight (from top to bottom). [Also in postscript] |
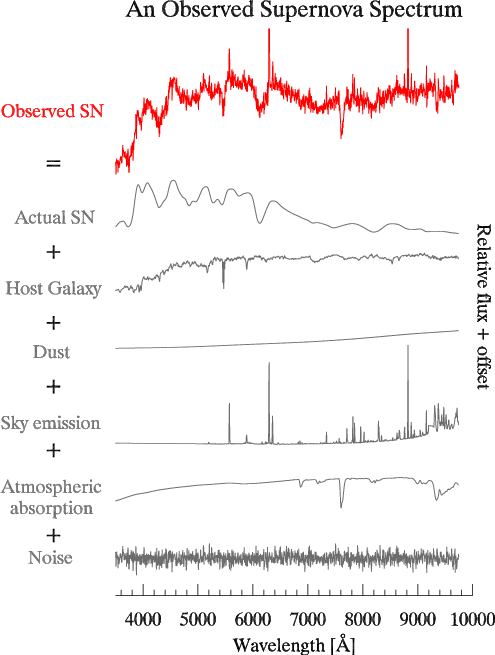
| An observed supernova spectrum (in red) and the various individual components (most of which non-supernova!) with which observers have to deal with. [Also in postscript] |