System overview
We now briefly introduce the system context and design and discuss the background to the present document.
The DPDD aims at covering the data products created and manipulated by the SGS data processing pipeline (and in the future it may also cover all data product types present in the EAS). By nature the document is centered on the products, and therefore this section aims at providing the more general context in which these products are found.
The data processing pipeline is summarized in the flow chart below that identifies the different Processing Functions as well as the information they create and exchange (a summarized version of the data products, this flow chart is taken from RD5).
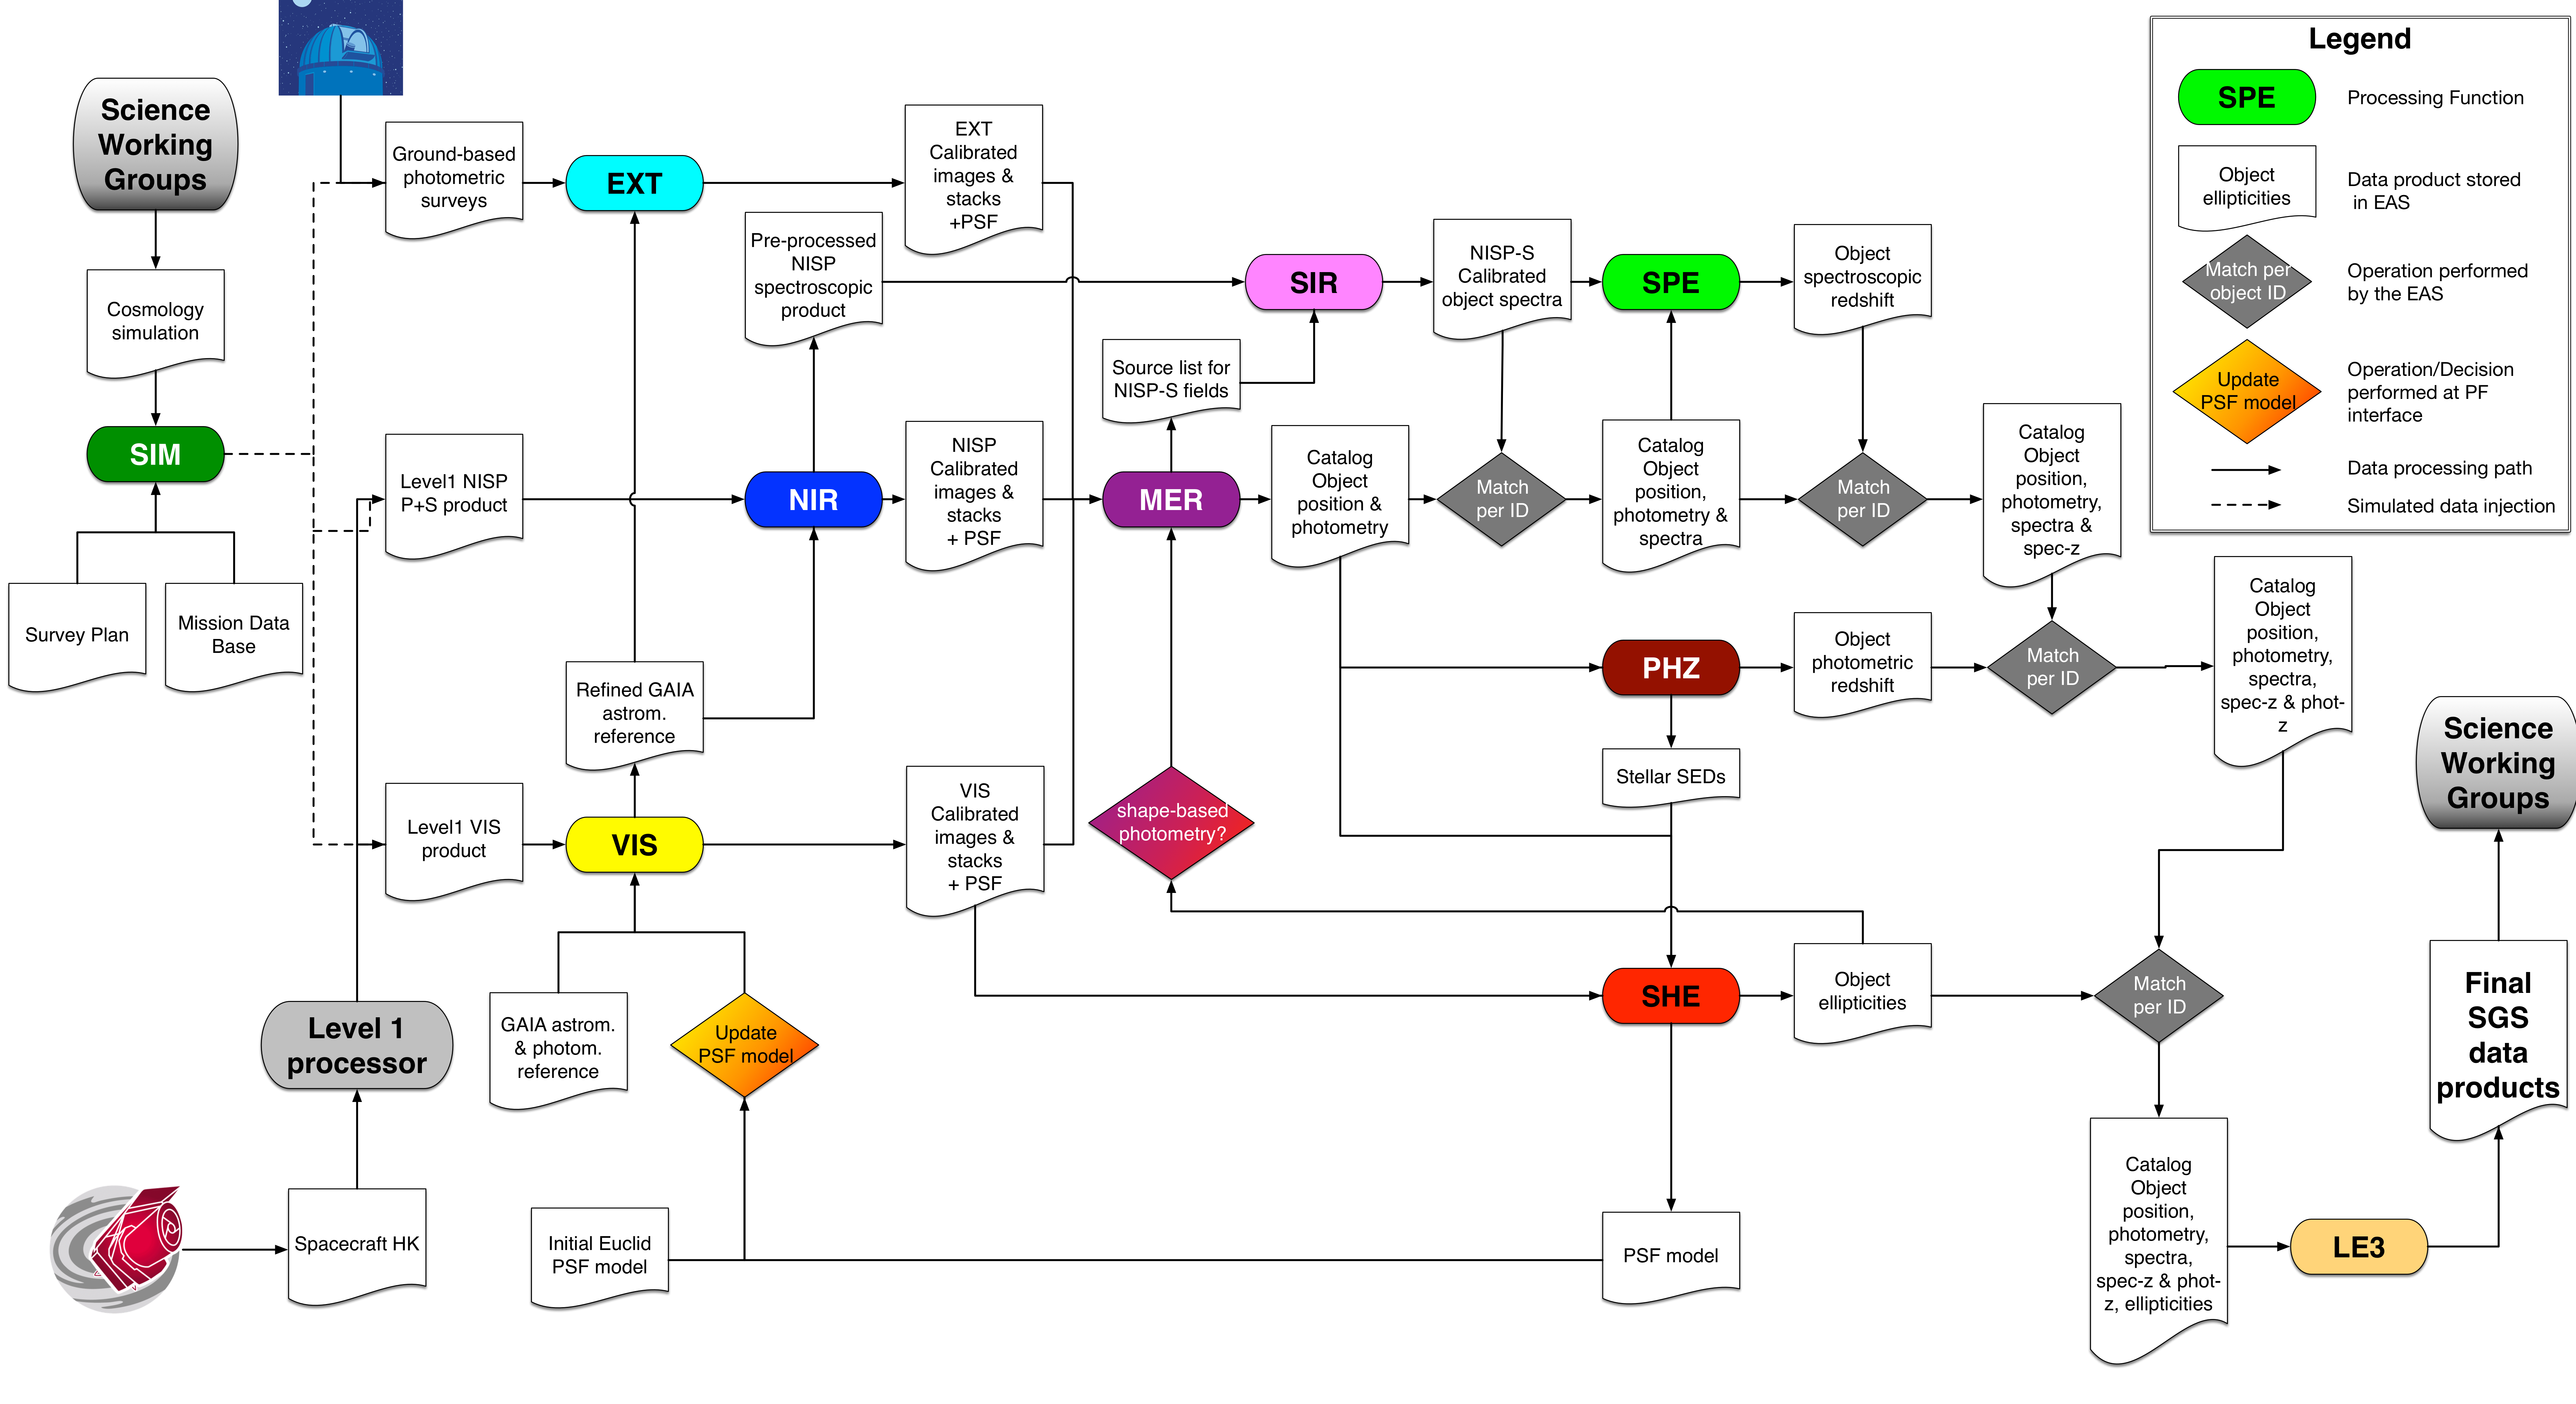
Fig. 1 : The complete flow-chart of the SGS pipeline, identifying the processing functions and the information they exchange.
on Fig. 1, the progress of pipeline processing is from left to right. At the “entrance” of the pipeline, one finds:
The Euclid satellite as the provider of VIS and NISP data.
The ground-based observatories as providers for the photometry in the visible bands.
the SIM OU that can inject simulated raw data in the pipeline, based on simulations provided by the SWG.
The input data products for the SGS pipeline are identified as the level 1 data products, created by the level 1 PF operating at the SOC.
The first PF to come into play is VIS, that, on top of producing calibrated VIS exposures, also updates the astrometric reference (inherited from GAIA) using the EUCLID VIS PSF model maitained by SHE. This update will consist mostly in adding fainter stars as references, and sometimes to correct the information.
Then NIR uses this refined reference to perform the calibration of the photometric NISP exposures. It also applies all the processing steps that are independent of the observing mode to the spectroscopic exposures to create the pre-processed NISP spectroscopic exposures for SIR.
In parallel (or significantly before, as the ground-based observatories’ schedules are independent from Euclid’s) EXT is calibrating the ground-based photometric exposures. This will happen in two steps so that we simply have to homogenize the astrometric and photometric solutions when the Euclid data becomes available.
With all the photometric exposures calibrated, MER will proceed to build the object catalog, by detecting objects on the VIS images (the deepest and best resolved ones), and applying forced photometry on all the other bands.
The object catalog (mostly positions) is used by SIR to find the objects that should have their spectrum in any given NISP spectroscopic exposures. It is only with the object’s location that SIR can extract spectra from its grism exposure while ensuring sufficient wavelenght accuracy.
The spectra are analyzed by SPE to measure the objects’ redshift, and qualify the certainty of the determination. SPE also identifies all the lines in the spectra and measures their fluxes. This information is fed back in the catalog.
The photometric catalog is the source of information that PHZ uses to determine photometric redshifts for all the sources, as well as the associated probability distribution function.
SHE is using both the catalog and the VIS images to determine the shape of the objects in the VIS image for the weak-lensing probe. The photometric information is necessary to understand how the spectral dependencies of the PSF model, determined on stars, has to be used when applied to galaxies.
Finally LE3 uses the catalog information (it will also use a range of visibility information) to produce the information that is relevant for the SWGs.